Source - http://serious-science.org/videos/1060
Nobel Prize laureate David Gross on Rutherford experiments, asymptotic freedom, and the origin of the particle masses

PLato said,"Look to the perfection of the heavens for truth," while Aristotle said "look around you at what is, if you would know the truth" To Remember: Eskesthai
Showing posts with label Sun. Show all posts
Showing posts with label Sun. Show all posts
Thursday, January 22, 2015
Quantum Chromodynamics
Monday, December 29, 2014
The Axion of the Quark Gluon Pasma?
In physics, an anomalon is a hypothetical type of nuclear matter that shows an anomalously large reactive cross section. They were first noticed in experimental runs in the early 1980s as short tracks in film emulsions or plastic leaf detectors connected to medium-energy particle accelerators. The direction of the tracks demonstrated that they were the results of reactions taking place within the accelerator targets, but they stopped so quickly in the detectors that no obvious explanation for their behavior could be offered. A flurry of theoretical explanations followed, but over time a series of follow-up experiments failed to find strong evidence for the anomalons, and active study of the topic largely ended by the late 1980s.
***
Professor Emeritus Piyare L. Jain is a particle physicist at University at Buffalo. On December 6, 2006, he claimed discovery of the long-sought axion subatomic particle. [1]
The discovery involved Jain's use of 3-dimensional photographic medium targets in heavy-ion particle accelerators; modern detectors using electronic sensors were unable to detect the axion due to the very short distances and times involved, but the physical medium was able to identify about 1,200 Axion traces over years of experiment. Jain is one of the few currently working physicists with experience with that type of detector, which had been largely abandoned in favor of the modern electronic detectors.
***
Axions, would also have stopped interaction with normal matter at a different moment than other more massive dark particles. The lingering effects of this difference could perhaps be calculated and observed astronomically. Axions may hold the key to the Solar Corona heating problem.[40] See: Axion
***
Uploaded on Jan 9, 2011SETI Archive: http://seti.org/talks
The Sun's outer atmosphere or corona is heated to millions of degrees, considerably hotter than its cool surface or photosphere. Explanations for this long-standing enigma typically invoke the deposition in the corona of non-thermal energy generated by the interplay of convection and magnetic fields. However, the exact physical mechanism driving coronal heating remains unknown. During the past few years, recently built instruments like the Japanese Hinode satellite, the Swedish Solar Telescope in Spain and NASA's Solar Dynamics Observatory (SDO) combined with advanced numerical simulations have revealed a new window into how the Sun's atmosphere is energized. These results directly challenge current theories and highlight the importance of the interface region between the photosphere and corona for understanding how the solar atmosphere is heated. Dr. De Pontieu will present some of these results and describe how NASA's recently selected Interface Region Imaging Spectrograph, which is being built by Lockheed Martin's Solar and Astrophysics Laboratory in Palo Alto, in collaboration with NASA Ames, Smithsonian Astrophysical Observatory (SAO), Montana State University, Stanford University and the University of Oslo, will be able to address many of the outstanding issues and problems.
***
An article on IAXO has been published in the September 2014 issue of the CERN Courier. You can see the online version of the article here (link is external), or dowload the full CERN Courier issue here (link is external).
The central component of iAXo is a superconducting toroid magnet. The detector relies on a high magnetic field distributed across a large volume to convert solar axions to detectable X-ray photons. The magnet’s figure of merit is proportional to the square of the product of magnetic field and length, multiplied by the cross-sectional area filled with the magnetic field.IAXO: the International Axion Observatory -Pg 9 Sept 2014(PDF)
Sunday, October 19, 2014
IRIS(Interface Region Imaging Spectrograph) and the Latest
.jpg) |
| Interface Region Imaging Spectrograph (IRIS) Graphic of proposed IRIS spacecraft. The IRIS instrument is a multi-channel imaging spectrograph with a 20 cm UV telescope. IRIS will obtain spectra along a slit (1/3 arcsec wide), and slit-jaw images. Credit: NASA |
The Interface Region Imaging Spectrograph (IRIS) is a NASA solar observation satellite. The mission was funded through the Small Explorer program to investigate the physical conditions of the solar limb, particularly the chromosphere of the Sun. The spacecraft consists of a satellite bus and spectrometer built by the Lockheed Martin Solar and Astrophysics Laboratory (LMSAL), and a telescope provided by the Smithsonian Astrophysical Observatory. IRIS is operated by LMSAL and NASA's Ames Research Center.
The satellite's instrument is a high-frame-rate ultraviolet imaging spectrometer, providing one image per second at 0.3 arcsecond spatial resolution and sub-ångström spectral resolution.
NASA announced on 19 June 2009 that IRIS was selected from six small explorer mission candidates for further study,[3] along with the Gravity and Extreme Magnetism (GEMS) space observatory.[4]
The spacecraft arrived at Vandenberg Air Force Base, California, on 16 April 2013[5] and was successfully launched on 27 June 2013 by a Pegasus-XL rocket.[6] IRIS achieved first light on 17 July 2013.[7] NASA noted, "IRIS's first images showed a multitude of thin, fibril-like structures that have never been seen before, revealing enormous contrasts in density and temperature occur throughout this region even between neighboring loops that are only a few hundred miles apart."[7] On 31 October 2013, calibrated IRIS data and images were released on the project website.[8] A preprint describing the satellite and initial data has been released on the arXiv.[9]
***
NASA's newest sun-watcher, the Interface Region Imaging Spectrograph, launched in 2013 with a specific goal: track how energy and heat coursed through a little understood region of the sun called the interface region. Sandwiched between the solar surface and its outer atmosphere, the corona, the interface region is where the cooler temperatures of the sun's surface transition to the hotter temperatures above. Moreover, all the energy to power the sun's output -- including eruptions such as solar flares and the sun's constant outflow of particles called the solar wind -- must make its way through this region. See:
NASA's IRIS Helps Explain Mysterious Heating of the Solar Atmosphere
Tuesday, September 30, 2014
Stellar flares seen from a nearby red dwarf star.
On April 23, NASA's Swift satellite detected the strongest, hottest, and longest-lasting sequence of stellar flares ever seen from a nearby red dwarf star. The initial blast from this record-setting series of explosions was as much as 10,000 times more powerful than the largest solar flare ever recorded. At its peak, the flare reached temperatures of 360 million degrees Fahrenheit (200 million Celsius), more than 12 times hotter than the center of the sun. The "superflare" came from one of the stars in a close binary system known as DG Canum Venaticorum, or DG CVn for short, located about 60 light-years away. Both stars are dim red dwarfs with masses and sizes about one-third of our sun's. They orbit each other at about three times Earth's average distance from the sun, which is too close for Swift to determine which star erupted. See: NASA | Swift Catches Mega Flares from a Mini Star
Wednesday, September 10, 2014
Ovation Aurora

The Space Weather Prediction Center and the Space Weather Prediction Testbed have introduced a new Auroral Forecast test product in an effort to improve services to current customers and expand our customer base with new products. The Auroral Forecast product is based on the OVATION Prime model which provides a 30-40 minute forecast on the location and probability of auroral displays for both the northern and southern polar regions. The development and implementation of this model has been a joint effort. The model itself was developed by P. Newell at the Johns Hopkins, Applied Physics Lab. Scientists at the NESDIS National Geophysical Data Center (NGDC) added further refinements to make the model run in real time. Researchers at the Space Weather Prediction Testbed validated the model and developed graphical displays. This model is driven by real-time solar wind and interplanetary magnetic field information from the Advanced Composition Explorer (ACE) satellite. The model is based on more than 11 years of data from the Defense Meteorlogical Satellite Program (DMSP) from which an empirical relationship between the solar wind conditions and the aurora location and intensity was developed. SEE: Ovation Aurora
***
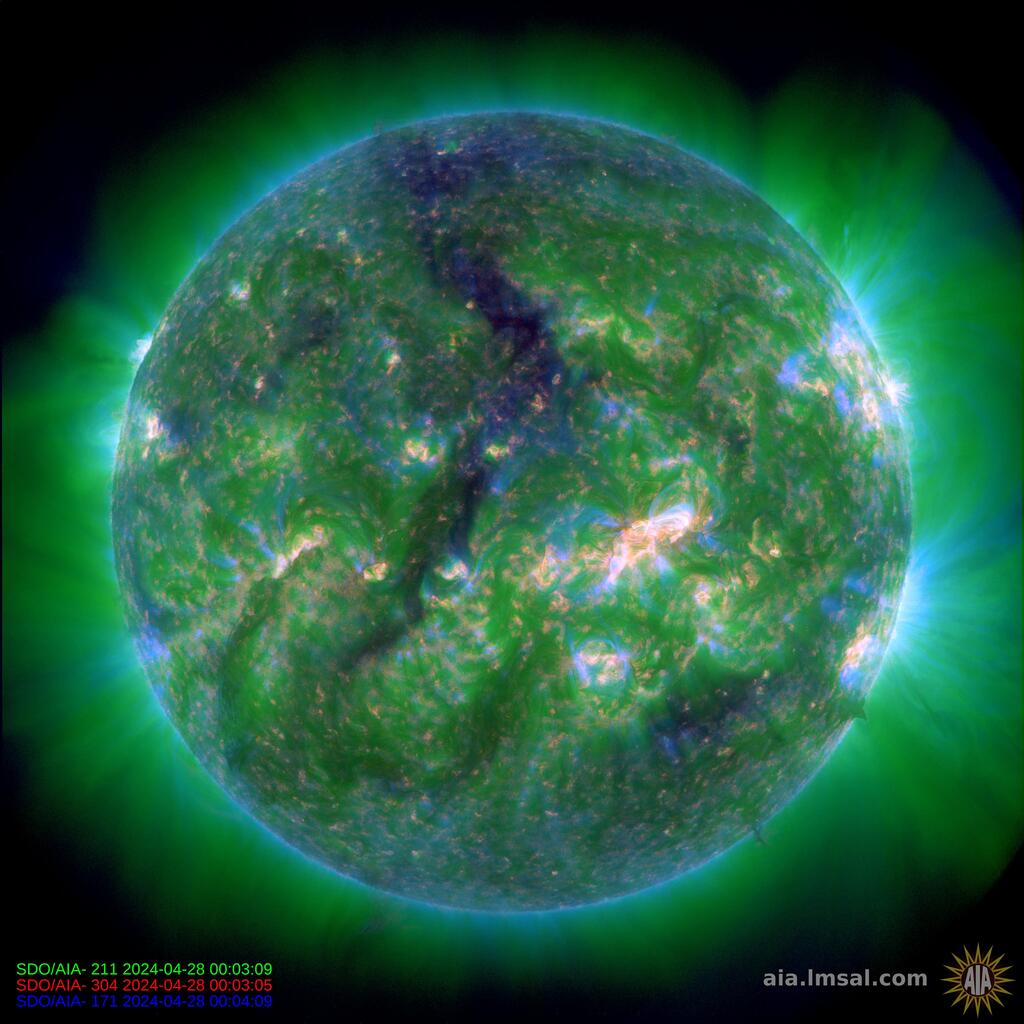
 |
| SOHO EIT 304 Latest Image |
***
Monday, September 08, 2014
The Sun Current
Thursday, July 24, 2014
The Sun
 | ||
| 24 July 2014 - Mission Day: 6810 - DOY: 205 |
"Courtesy of NASA/SDO and the AIA, EVE, and HMI science teams."
***
Spun and Confused
Published on Jul 21, 2014A long arch of plasma (called a prominence) was pulled this way and that by magnetic forces for a week before it finally dissipated (July 10-16, 2014). This close up was captured in extreme ultraviolet light. The Earth scale in the lower left corner gives one a sense of the length of the prominence. This one held itself together for quite a long time, as these things go. Credit: Solar Dynamics Observatory/NASA.
Sunday, June 29, 2014
Puffing in Large Scale Interactions
 |
This
combination of three wavelengths of light from NASA's Solar Dynamics
Observatory shows one of the multiple jets that led to a series of slow
coronal puffs on Jan. 17, 2013. The light has been colorized in red,
green and blue.
Image Credit: Alzate/SDO
|
A suite of NASA's sun-gazing spacecraft have spotted an unusual series of eruptions in which a series of fast puffs forced the slow ejection of a massive burst of solar material from the sun's atmosphere. The eruptions took place over a period of three days, starting on Jan. 17, 2013. Nathalia Alzate, a solar scientist at the University of Aberystwyth in Wales, presented findings on what caused the puffs at the 2014 Royal Astronomical Society's National Astronomy Meeting in Portsmouth, England. See: Puffing Sun Gives Birth To Reluctant Eruption
Monday, March 17, 2014
BICEP2 Observatory in Antarctica
 |
Cosmic searches at the South Pole. The BICEP-2
Telescope is the up-facing dish at right. The larger white dish is the
South Pole Telescope (SPT), and the building is the Dark Sector
Laboratory. Both experiments observe in the millimeter-submillimeter
part of the spectrum, mapping polarization patterns in the cosmic
background radiation.
|

...... will announce a “major discovery” about B-modes in the cosmic microwave background See: Who should get the Nobel Prize for cosmic inflation?
UPDATE:
Closing thoughts -
BICEP2: Primordial Gravitational Waves!
The BICEP result, if correct, is a spectacular and historic discovery. In terms of impact on fundamental physics, particularly as a tool for testing ideas about quantum gravity, the detection of primordial gravitational waves is completely unprecedented. Inflation evidently occurred just two orders of magnitude below the Planck scale, and we have now seen the quantum fluctuations of the graviton. For those who want to understand how the universe began, and also for those who want to understand quantum gravity, it just doesn't get any better than this.
In fact, it all seems far too good to be true. And perhaps it is: check back after another experimental team is able to check the BICEP findings, and then we can really break out the champagne.
This should be really interesting.
***
Stanford Professor Andrei Linde celebrates physics breakthrough
***
See Also:
Wednesday, December 18, 2013
Wavelength Views of the Sun
This movie, created by NASA's Scientific Visualization Studio at NASA's Goddard Space Flight Center in Greenbelt, Md., shows how features of the sun can appear dramatically different when viewed in different wavelengths. Image Credit: NASA's Goddard Space Flight Center
Telescopes help distant objects appear bigger, but this is only one of their advantages. Telescopes can also collect light in ranges that our eyes alone cannot see, providing scientists ways of observing a whole host of material and processes that would otherwise be inaccessible. A new NASA movie of the sun based on data from NASA's Solar Dynamics Observatory, or SDO, shows the wide range of wavelengths – invisible to the naked eye – that the telescope can view. SDO converts the wavelengths into an image humans can see, and the light is colorized into a rainbow of colors.NASA's SDO Shows the Sun's Rainbow of Wavelengths
Thursday, July 04, 2013
NASA | First X-Class Solar Flares of 2013
Published on May 13, 2013
On May 12-13 the sun erupted with an X1.7-class and an X2.8-class flare as well as two coronal mass ejections, or CMEs, off the upper left side of the sun. Solar material also danced and blew off the sun in what's called a prominence eruption, both in that spot and on the lower right side of the sun. This movie compiles imagery of this activity from NASA's Solar Dynamics Observatory and from the ESA/NASA Solar Heliospheric Observatory.
Music: "Long Range Cruise" by Lars Leonhard, courtesy of the artist and BineMusic. www.lars-leonhard.de
This video is public domain and can be downloaded at: http://svs.gsfc.nasa.gov/vis/a010000/...
Tuesday, June 25, 2013
Iris-Interface Region Imaging Spectrograph
 |
| This graphic shows the IRIS observatory with the solar arrays removed. The orange section to the left is the spacecraft bus which includes the spacecraft support structure, the command and data handling system, power distribution system, reaction wheels, X- and S-Band communications systems, Li-Ion battery, magnetic torque rods, and electronics for the sun sensors. The section to the right of the spacecraft includes the instrument optics package and electronics, several components of the attitude control system, and the solar arrays. The instrument includes a 20cm telescope optimized for solar observations which feeds a 5 channel imaging spectrograph. The green section is the telescope assembly, the light blue section is the spectrograph, and the dark blue box is the separate instrument electronics box. Credit: LMSAL, LM ATC |
NASA is getting ready to launch a new mission, a mission to observe a largely unexplored region of the solar atmosphere that powers its dynamic million-degree outer atmosphere and drives the solar wind. In late June 2013, the Interface Region Imaging Spectrograph, or IRIS, will launch from Vandenberg Air Force Base, Calif. IRIS will advance our understanding of the interface region, a region in the lower atmosphere of the sun where most of the sun's ultraviolet emissions are generated. Such emissions impact the near-Earth space environment and Earth's climate. See:IRIS: Studying the Energy Flow that Powers the Solar Atmosphere
 |
| This image shows the Heliophysics System Observatory (HSO). The HSO utilizes the entire fleet of solar, heliospheric, geospace, and planetary spacecraft as a distributed observatory to discover the larger scale and/or coupled processes at work throughout the complex system that makes up our space environment. The HSO consist of 18 operating missions: Voyager, Geotail, Wind, SOHO, ACE, Cluster, TIMED, RHESSI, TWINS, Hinode, STEREO, THEMIS, AIM, CINDI, IBEX, SDO, ARTEMIS, Van Allen Probes Credit: NASA |
Thursday, May 02, 2013
NASA operates a system observatory of Heliophysics missions
 |
| The Heliophysics System Observatory (HSO) showing current operating missions, missions in development, and missions under study. Credit: NASA |
NASA operates a system observatory of Heliophysics missions, utilizing the entire fleet of solar, heliospheric, and geospace spacecraft to discover the processes at work throughout the space environment. In addition to its science program, NASA’s Heliophysics Division routinely partners with other agencies to fulfill the space weather research or operational objectives of the nation. See: What are our current capabilities to predict space weather?

See Also:
Wednesday, February 20, 2013
Loop Production on the Sun
On July 19, 2012, an eruption occurred on the sun that produced a moderately powerful solar flare and a dazzling magnetic display known as coronal rain. Hot plasma in the corona cooled and condensed along strong magnetic fields in the region. Magnetic fields, are invisible, but the charged plasma is forced to move along the lines, showing up brightly in the extreme ultraviolet wavelength of 304 Angstroms, and outlining the fields as it slowly falls back to the solar surface See: Raining Loops on the Sun

See Also:
Sunday, August 26, 2012
Radiation Belt Storm Probes (RBSP)
The launch of an Atlas V carrying NASA's Radiation Belt Storm Probes (RBSP) payload was scrubbed today due to weather conditions associated with lightning, as well as cumulus and anvil clouds. With the unfavorable weather forecast as a result of Tropical Storm Isaac, the leadership team has decided to roll the Atlas V vehicle back to the Vertical Integration Facility to ensure the launch vehicle and twin RBSP spacecraft are secured and protected from inclement weather. Pending approval from the range, the launch is rescheduled to Thursday, Aug. 30 at 4:05 a.m. Eastern Daylight Time. See: RBSP Launch Targeted for No Earlier Than Aug. 30

RBSP is being designed to help us understand the Sun’s influence on Earth and Near-Earth space by studying the Earth’s radiation belts on various scales of space and time.
The instruments on NASA’s Living With a Star Program’s (LWS) Radiation Belt Storm Probes (RBSP) mission will provide the measurements needed to characterize and quantify the plasma processes that produce very energetic ions and relativistic electrons. The RBSP mission is part of the broader LWS program whose missions were conceived to explore fundamental processes that operate throughout the solar system and in particular those that generate hazardous space weather effects in the vicinity of Earth and phenomena that could impact solar system exploration. RBSP instruments will measure the properties of charged particles that comprise the Earth’s radiation belts, the plasma waves that interact with them, the large-scale electric fields that transport them, and the particle-guiding magnetic field.
The two RBSP spacecraft will have nearly identical eccentric orbits. The orbits cover the entire radiation belt region and the two spacecraft lap each other several times over the course of the mission. The RBSP in situ measurements discriminate between spatial and temporal effects, and compare the effects of various proposed mechanisms for charged particle acceleration and loss. See: RBSP
 | |
| Credit: NASA/Johns Hopkins University Applied Physics Laboratory |
Engineers at the Johns Hopkins University Applied Physics Laboratory in Laurel, Md., prepare to place Radiation Belt Storm Probes spacecraft "B" in a thermal-vacuum chamber, where they can make sure the propulsion system will stand up to the range of hot, cold and airless conditions RBSP will face in outer space. This round of testing took place in late October-early November 2010.

See Also:
Friday, July 13, 2012
EO: Earth Observatory

Twelve years after the Earth was buffeted by one of the more potent Sun storms in modern history, our nearest star crackled with activity again. A solar flare erupted on July 12, 2012, followed closely by a companion coronal mass ejection (CME)—a cloud of magnetically charged particles and energy that can disturb Earth’s magnetic field, disrupt satellites and ground-based electronics, and provoke auroras.
The Atmospheric Imaging Assembly on NASA's Solar Dynamics Observatory (SDO) captured these views of the flare in the Sun’s southern hemisphere on July 12, 2012. The top, global image shows the Sun as viewed at 131 Angstroms; the lower, close-up view is 171 Angstroms. Both ultraviolet wavelengths help solar physicists study the fine magnetic structures in the Sun’s super-heated atmosphere, or corona. The yellow and teal are false colors chosen by the science team to distinguish between the spectral bands. Download the movies linked beneath each image to see the active region develop and erupt. See:The Sun Erupts

An X1.4 class flare erupted from the center of the sun, peaking on July 12, 2012 at 12:52 PM EDT. It erupted from Active Region 1520 which rotated into view on July 6.
This video uses SDO AIA footage in 131(teal), 171(gold) and 335 (blue) angstrom wavelengths. Each wavelength shows different temperature plasma in the sun's atmosphere. 171 shows 600,000 Kelvin plasma, 335 shows 2.5 million Kelvin plasma, and 131 shows 10 million Kelvin plasma.
This video is public domain and can be downloaded at: http://svs.gsfc.nasa.gov/goto?11043

See Also:
Monday, July 09, 2012
Latest SDO IMage
 |
| This image taken by SDO's AIA instrument at 171 Angstrom shows the current conditions of the quiet corona and upper transition region of the Sun. |
 |
| Active Region 1515 released an M6.9 class flare beginning at 12:23 PM EDT and peaking at 12:32 on July 7, 2012. This region has been the source of much solar activity since July 2. |

See: Today's Space Weather
 |
| This plot shows 3-days of 5-minute solar x-ray flux values measured on the SWPC primary GOES satellite. One low value may appear prior to eclipse periods. Click on the plot to open an updating secondary window. 6-hour 1-min Solar X-ray Flux plot. |
Monday, April 23, 2012
Songs of the Stars: the Real Music of the Spheres
With the discovery of sound waves in the CMB, we have entered a new era of precision cosmology in which we can begin to talk with certainty about the origin of structure and the content of matter and energy in the universe.-Wayne Hu

The Pythagoreans 2500 years ago believed in a celestial "music of the spheres", an idea that reverberated down the millennia in Western music, literature, art and science. Now, through asteroseismology (the study of the internal structure of pulsating stars), we know that there is a real music of the spheres. The stars have sounds in them that we use to see right to their very cores. This multi-media lecture looks at the relationship of music to stellar sounds. You will hear the real sounds of the stars and you will hear musical compositions where every member of the orchestra is a real (astronomical) star! You will also learn about some of the latest discoveries from the Kepler Space Mission that lets us "hear" the stars 100 times better than with telescopes on the ground See:Don Kurtz, University of Central Lancashire-Wednesday, May 2, 2012 at 7:00 pm

See Also:
Sunday, March 04, 2012
Finding the Limits of Science?


By 'dilating' and 'expanding' the scope of our attention we not only discover that 'form is emptiness' (the donut has a hole), but also that 'emptiness is form' (objects precipitate out of the larger 'space') - to use Buddhist terminology. The emptiness that we arrive at by narrowing our focus on the innermost is identical to the emptiness that we arrive at by expanding our focus to the outermost. The 'infinitely large' is identical to the 'infinitesimally small'. The Structure of Consciousness John Fudjack - September, 1999
While I may use the quote above to help explain a series of pictures above, it is also pointing how this inside/out relation with the world around us?

To take an investigative look at the world in which we live it was important to understand the "depth of our connection to reality?" I am not even sure that I am proceeding correctly but it is very important that I do so in a very scientifically correct way.
The dream is a little hidden door in the innermost and most secret recesses of the soul, opening into that cosmic night which was psyche long before there was any ego consciousness, and which will remain psyche no matter how far our ego consciousness extends.... All consciousness separates; but in dreams we put on the likeness of that more universal, truer, more eternal man dwelling in the darkness of primordial night. There he is still the whole, and the whole is in him, indistinguishable from nature and bare of all egohood. It is from these all-uniting depths that the dream arises, be it never so childish, grotesque, and immoral. Carl Jung
I can understand our science to a degree, as one can draw from the subjective analysis of, or, try to understand what we have learned in life. But to confront the known limits of our science is very important. To see experimental processes and phenomenological approaches as to satisfy this relation with science is also to discover something about ourselves as well.
 The Flammarion woodcut. Flammarion's caption translates to "A medieval missionary tells that he has found the point where heaven and Earth meet..."
Part of the understanding of looking at our world is not only a particulate understanding of reductionism but of a consolidating function of these constituents from a condense matter theorist point of view. How we make use of, as a understanding of the mass forming capabilities we are engaged in. While we engage in the theoretical, the foundation and basis of science is included. Conceptually the mathematics helps to build the concepts. The very schematics of these geometric forms are buried deep within us?
If conceived as a series of ever-wider experiential contexts, nested one within the other like a set of Chinese boxes, consciousness can be thought of as wrapping back around on itself in such a way that the outermost 'context' is indistinguishable from the innermost 'content' - a structure for which we coined the term 'liminocentric'.
If understood to the degree to which we are looking at the frequencies of how we look at the universe it is how we will see different parts of the universe in different ways. So this allows us to see a greater depth to the universe in which we did not understand before.
 |
| A picture of the sun taken "over time" in gamma ray detection. |
But I do contend that before we concrete our relation with reality we saw all these sensual factors as different facets of the same thing? This is before we became acclimatize to the reality with which we choose to live?
Friday, December 16, 2011
Comet LoveJoy
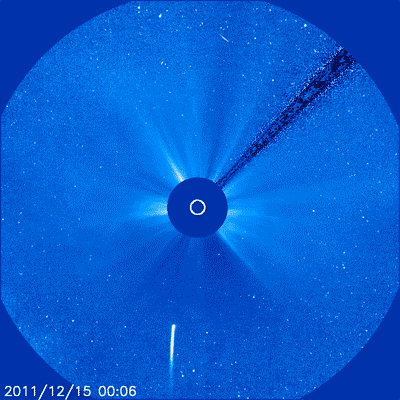 |
| Comet Lovejoy seen by SOHO |
“On average, new Kreutz-group comets are discovered every few days by SOHO, but from the ground they are much rarer to see or discover,” says Karl Battams, Naval Research Laboratory, who curates the Sun-grazing comets webpage. See Also: The beginning of the end for comet Lovejoy
One instrument watching for the comet was the Solar Dynamics Observatory (SDO), which adjusted its cameras in order to watch the trajectory. Not only does this help with comet research, but it also helps orient instruments on SDO -- since the scientists know where the comet is based on other spacecraft, they can finely determine the position of SDO's mirrors. This first clip from SDO from the evening of Dec 15, 2011 shows Comet Lovejoy moving in toward the sun.
Comet Lovejoy survived its encounter with the sun. The second clip shows the comet exiting from behind the right side of the sun, after an hour of travel through its closest approach to the sun. By tracking how the comet interacts with the sun's atmosphere, the corona, and how material from the tail moves along the sun's magnetic field lines, solar scientists hope to learn more about the corona. This movie was filmed by the Solar Dynamics Observatory in 171 Angstrom wavelength, which is typically shown in yellow.
Credit: NASA/SDO
 |
| The Very Latest SOHO Images |
Subscribe to:
Posts (Atom)